Experiment record
Long-term home environmental sensing with SwitchBot, Google Apps Script, and external weather observations — revised
A residential environmental logger continuously collects 12 SwitchBot sensor endpoints at a nominal five-minute cadence. The original physical analysis used 104,578 rows from 2026-07-28 through 2026-08-13. A 2026-09-06 longitudinal audit found 270,760 private Measurements rows: 270,698 SUCCESS and 62 ERROR, a row-level API-state success fraction of about 99.977%. Raw row count is not equivalent to the number of unique nominal five-minute observation slots, so completeness requires timestamp normalization.
Conclusion
A long-running residential environmental dataset was built using SwitchBot sensors, SwitchBot OpenAPI v1.1, Google Apps Script, and Google Sheets. The final enabled configuration contains 12 environmental sensor endpoints and stores temperature, relative humidity, calculated absolute humidity, CO2 where supported, battery state, API state, and execution metadata.
The original verified physical-analysis window covered approximately 2026-07-28 05:28 through 2026-08-13 21:28. It contained 104,578 Measurements rows: 104,564 SUCCESS and 14 ERROR. That subset supported the previously published findings on strong attic thermal variation, high crawl-space relative humidity with absolute humidity close to outdoors, temporary CO2 peaks, and strong correlation between the household outdoor sensor and external weather observations.
A new longitudinal audit on 2026-09-06 found that the private Measurements store had grown to 270,760 rows. Row-level API state was 270,698 SUCCESS and 62 ERROR, or approximately 99.977% SUCCESS.
That 270,760-row count must not be interpreted directly as the number of successful five-minute observations. The retained raw table contains target/acquisition-related timestamps and record timestamps, and inspection found interleaved timestamp patterns. Therefore raw row count is not the same as the number of unique nominal five-minute observation slots; missingness and completeness must be evaluated after timestamp normalization.
This revision does not silently replace the original thermal, moisture, and CO2 statistics with full-period statistics. The existing statistics and figures remain scoped to the original verified subset. Full-period physical aggregates through 2026-09-06 will be recomputed only after the observation-slot, duplicate, and delayed-record rules are fixed.
2026-09-06 longitudinal update
Observed facts
| Item | Original analysis at 2026-08-13 | Longitudinal audit at 2026-09-06 |
|---|---|---|
| Observation start | about 2026-07-28 05:28 | same |
| Observation end | about 2026-08-13 21:28 | about 2026-09-06 23:10 target time |
Measurements rows | 104,578 | 270,760 |
SUCCESS | 104,564 | 270,698 |
ERROR | 14 | 62 |
| Row-level success fraction | about 99.987% | about 99.977% |
| Enabled environmental sensors | 12 | 12 |
The absolute number of ERROR rows increased from 14 to 62, but the observation period and stored row count also expanded substantially. Error count alone therefore does not demonstrate degraded reliability.
Newly identified data-quality issue
Inspection near the end of the raw table found intervals in which rows tied to nominal five-minute target times coexist with rows reflecting different acquisition/record timing. A direct comparison between total row count and expected five-minute slots can therefore misclassify completeness.
Long-term quality is separated into at least four dimensions:
- API-row quality — whether each stored row is
SUCCESSorERROR. - Measurement quality — whether a value is physically plausible even when transport succeeded.
- Slot completeness — whether every expected nominal five-minute observation exists.
- Timestamp quality — whether target, acquisition, and storage times are delayed, duplicated, or otherwise inconsistent.
Accordingly, the 99.977% row-level API-state success fraction is not presented as a five-minute completeness rate.
Publication and privacy boundary
This article publishes experimental results and methods, not raw household telemetry. OpenAPI credentials, device IDs, spreadsheet identifiers, personally identifying room labels, precise residence location, exact external observation locations, and raw five-minute household series are withheld.
Published material is limited to acquisition design, anonymized locations, aggregation conditions, statistics, figures, operational failures, and analysis methodology needed for technical reuse.
1. Objective
The objective was to turn consumer environmental sensors from current-value displays into a persistent time-series platform suitable for later analysis of residential heat, moisture, ventilation, and external-weather coupling.
The main questions were whether outdoor, occupied, crawl-space, and attic zones show distinct thermal responses; whether high relative humidity corresponds to unusually high water-vapor content; whether CO2 can provide evidence about ventilation/occupancy changes; how closely the household outdoor sensor follows regional weather; and what data-quality failures appear during unattended long-term collection.
2. System architecture
The observed collection path is:
SwitchBot environmental sensors
        ↓
SwitchBot Cloud
        ↓
SwitchBot OpenAPI v1.1
        ↓
Google Apps Script
        ↓
Google Sheets
Measurements, device configuration, execution logs, settings, and external weather information were stored separately. Observed environmental device types included Meter, MeterPlus, MeterPro(CO2), and WoIOSensor.
The collector runs at a nominal approximately five-minute cadence, fetches each device status, normalizes device-type differences, calculates absolute humidity, and records temperature, relative humidity, absolute humidity, CO2 where available, battery state, and API state. Per-device exception handling prevents one temporary device failure from terminating the entire collection cycle.
Later assessment of LockService
The historical implementation used LockService to prevent overlapping writes. That remains an observed implementation fact. A later collector-completeness investigation, however, identified a control-flow risk in which failure to acquire a lock before observation could produce a silent gap.
This article therefore does not claim that use of LockService proves gap-free five-minute raw collection. Completeness must be verified from normalized observation timing rather than inferred from stored row count.
3. Absolute humidity
Because relative humidity is strongly temperature-dependent, absolute humidity was calculated and stored with the original readings.
e_s = 6.112 × exp((17.67 × T) / (T + 243.5))
AH = (2.1674 × e_s × RH) / (273.15 + T)
Here T is temperature in °C, RH is relative humidity in %, and AH is absolute humidity in g/m³. The implementation check at 20 °C and 50% RH gives about 8.64 g/m³.
4. Original verified physical-analysis window
All statistics and figures in this section refer only to approximately 2026-07-28 05:28 through 2026-08-13 21:28, containing 104,578 rows. They are not automatically generalized to the extended dataset through 2026-09-06.
4.1 Temperature
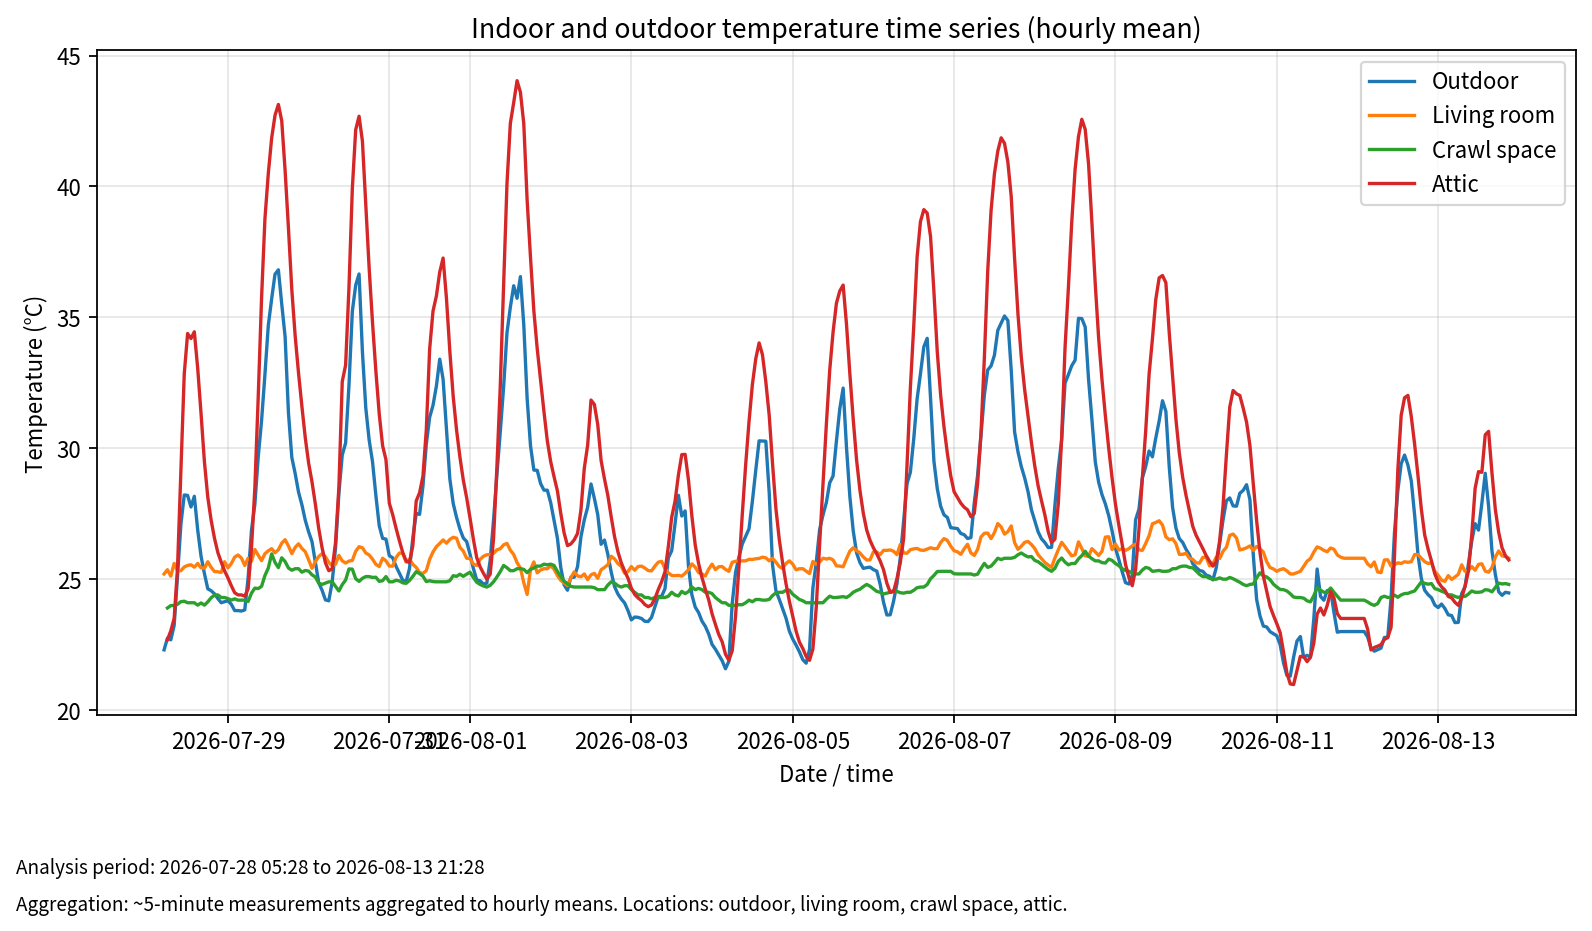
| Location | Mean | Minimum | Maximum |
|---|---|---|---|
| Outdoor | 26.90 °C | 21.2 °C | 37.6 °C |
| Living space | 25.80 °C | one implausible low value identified | 27.4 °C |
| Crawl space | 24.84 °C | 23.9 °C | 26.2 °C |
| Attic | 29.09 °C | 20.9 °C | 44.3 °C |
The attic showed the largest temperature excursions, while the crawl space remained in a much narrower band. This is an interpretation of the observed temperature series; heat flux was not measured directly.
4.2 Crawl-space relative and absolute humidity
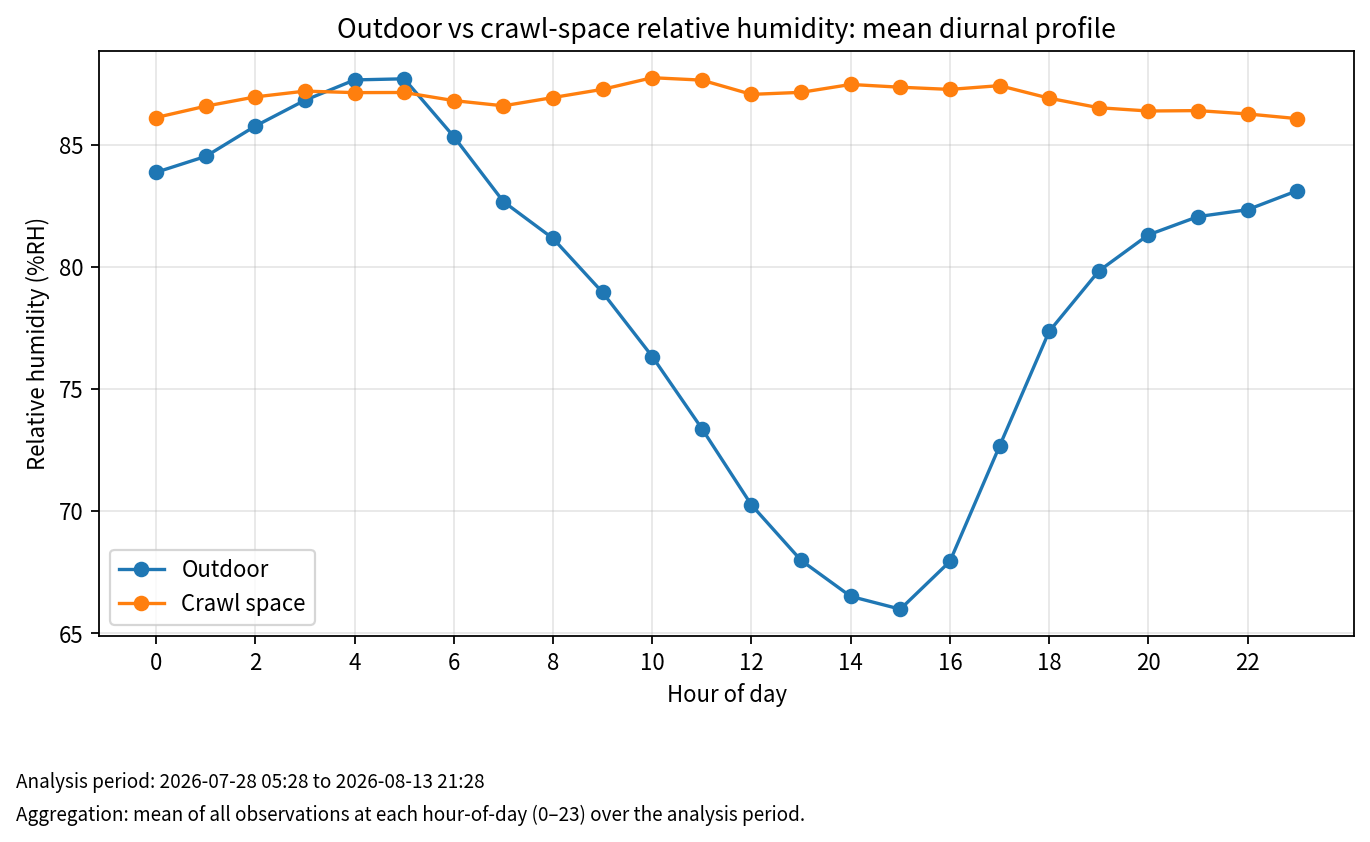
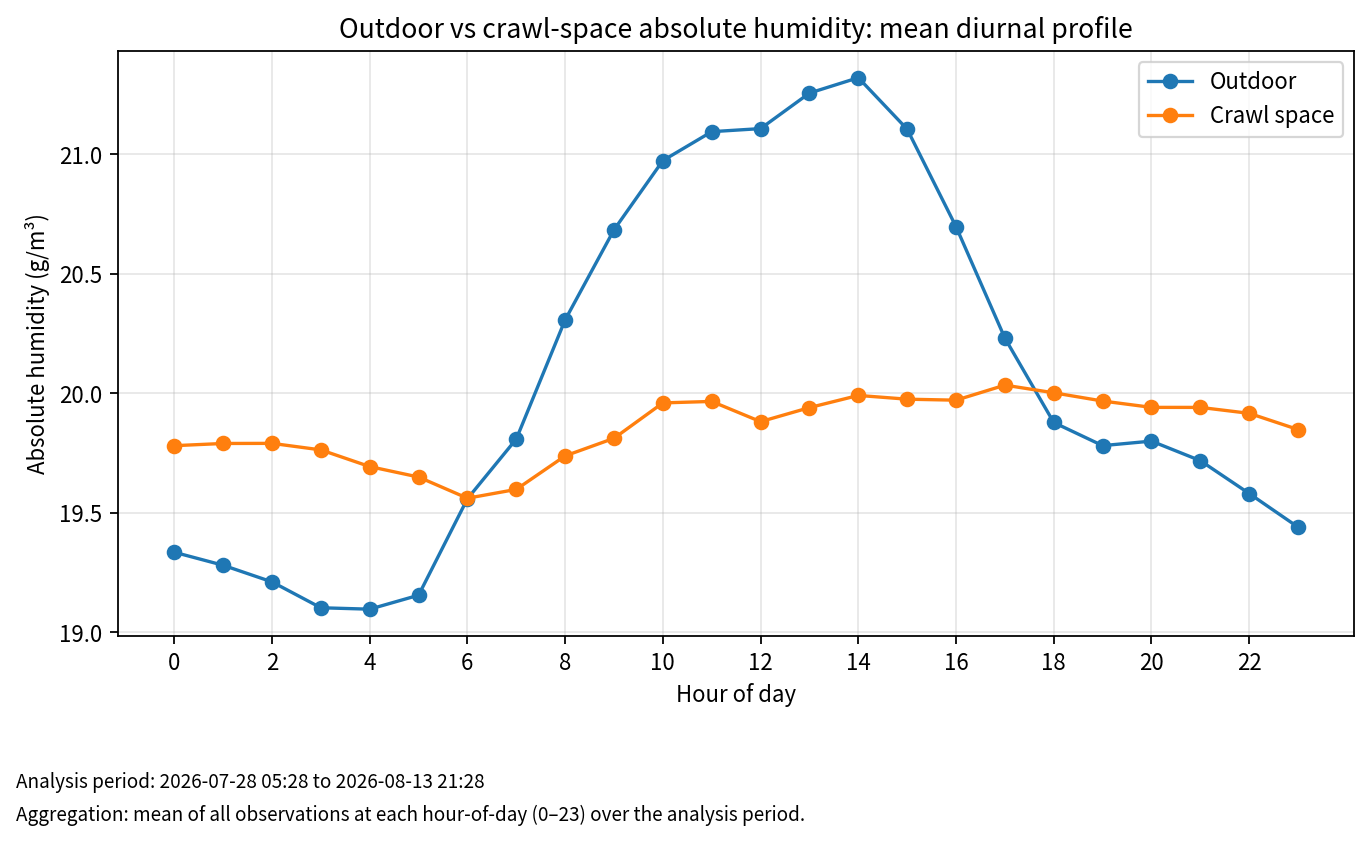
| Location | Mean RH | Mean absolute humidity |
|---|---|---|
| Outdoor | about 78.7% RH | about 20.08 g/m³ |
| Crawl space | about 86.9% RH | about 19.86 g/m³ |
The crawl space had higher relative humidity but absolute humidity close to outdoors. For this subset, the high RH was therefore inferred to be strongly influenced by lower temperature rather than representing a large excess of water vapor. This does not establish absence of condensation or mold risk.
4.3 CO2
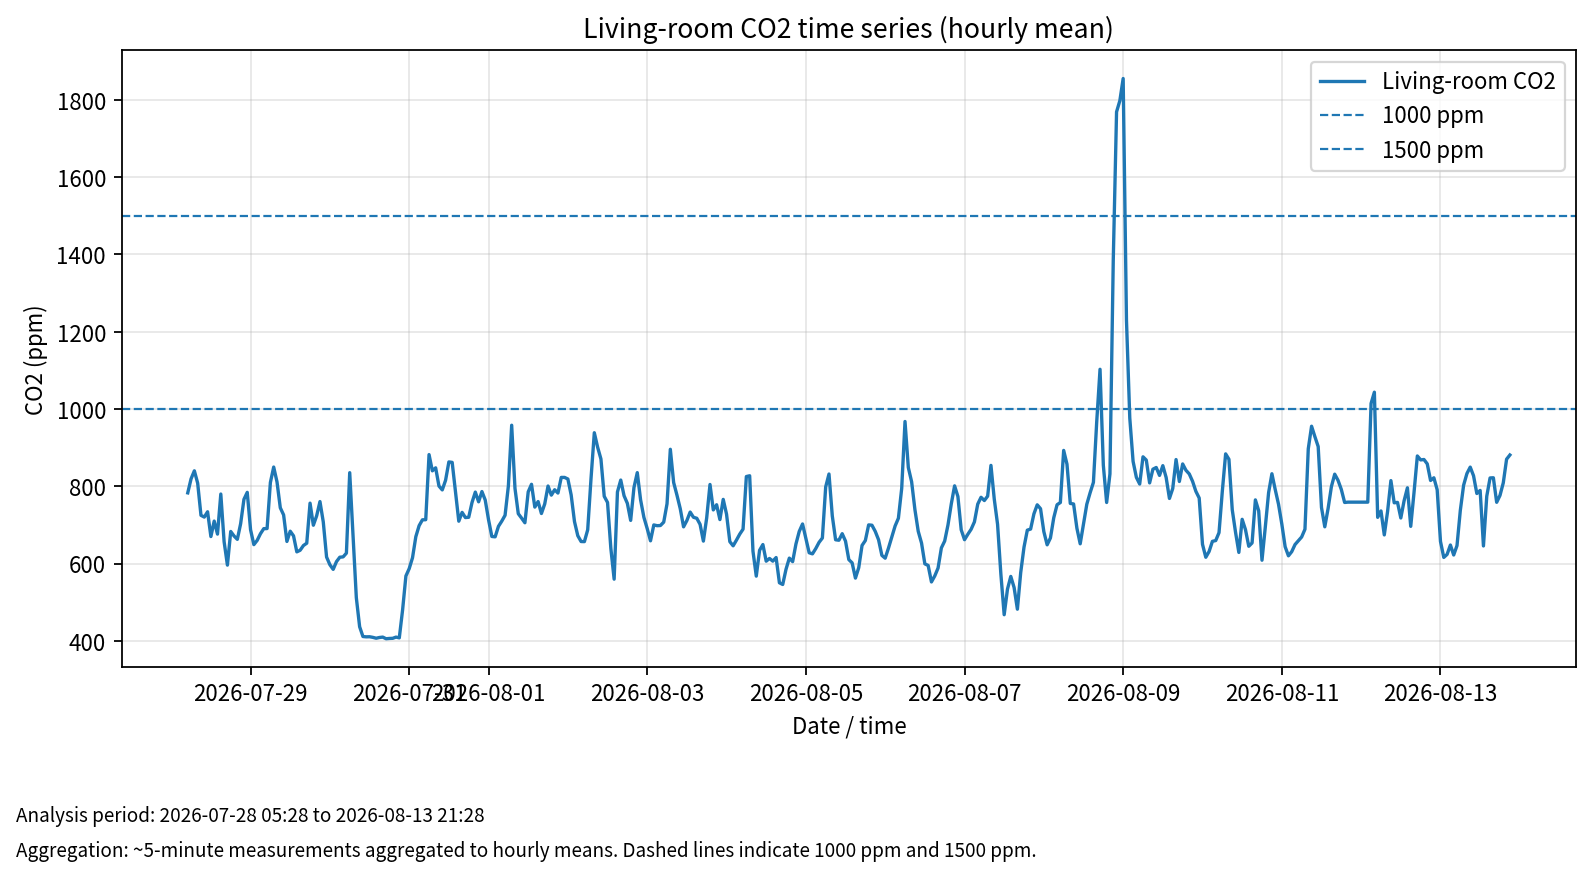
| Metric | CO2 |
|---|---|
| Median | about 729 ppm |
| 95th percentile | about 906 ppm |
| Maximum | 2,037 ppm |
| At or above 1,000 ppm | about 2.1% |
| At or above 1,500 ppm | about 0.94% |
Temporary peaks were observed, but the observational dataset alone does not establish a causal mapping to specific household activities.
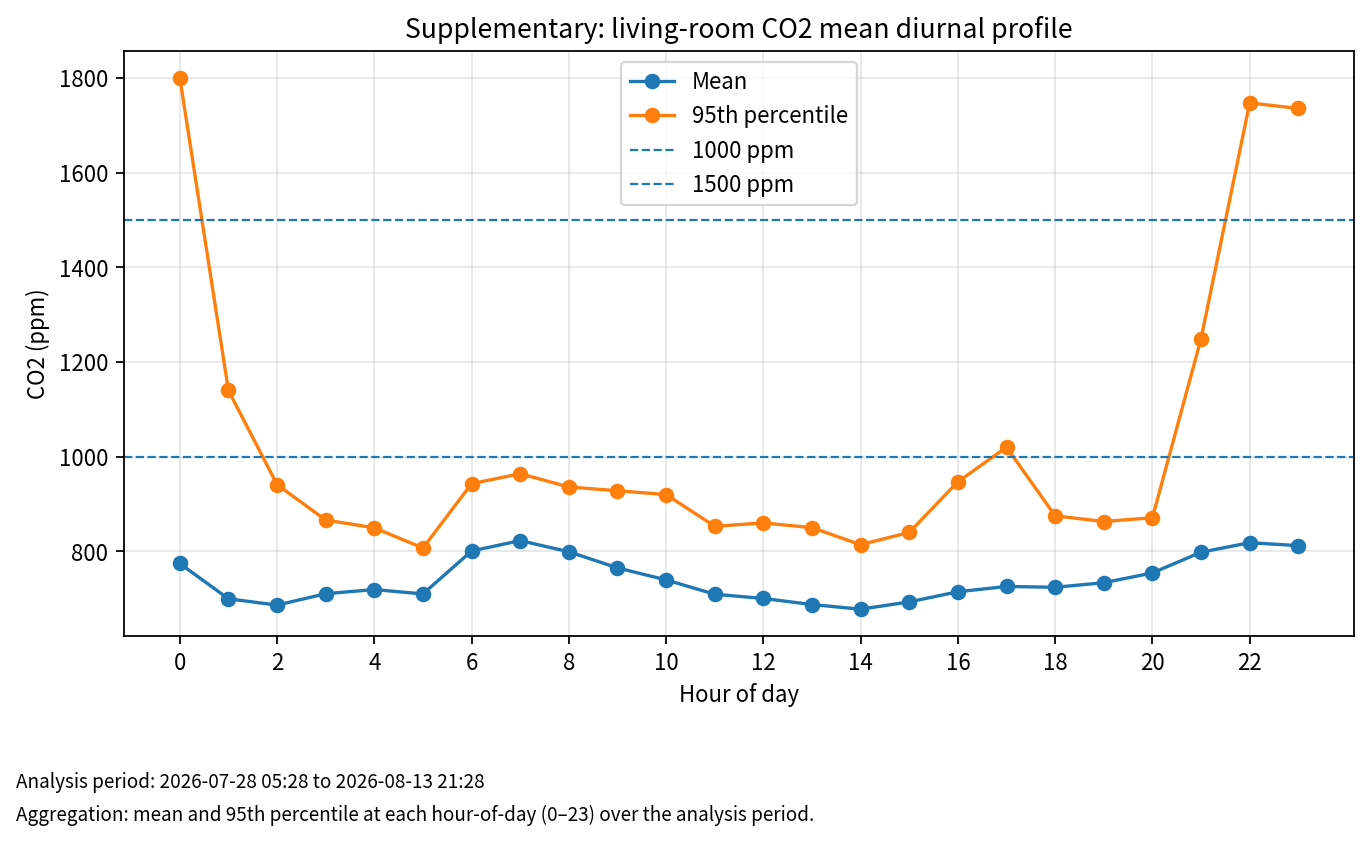
4.4 Comparison with external weather observations
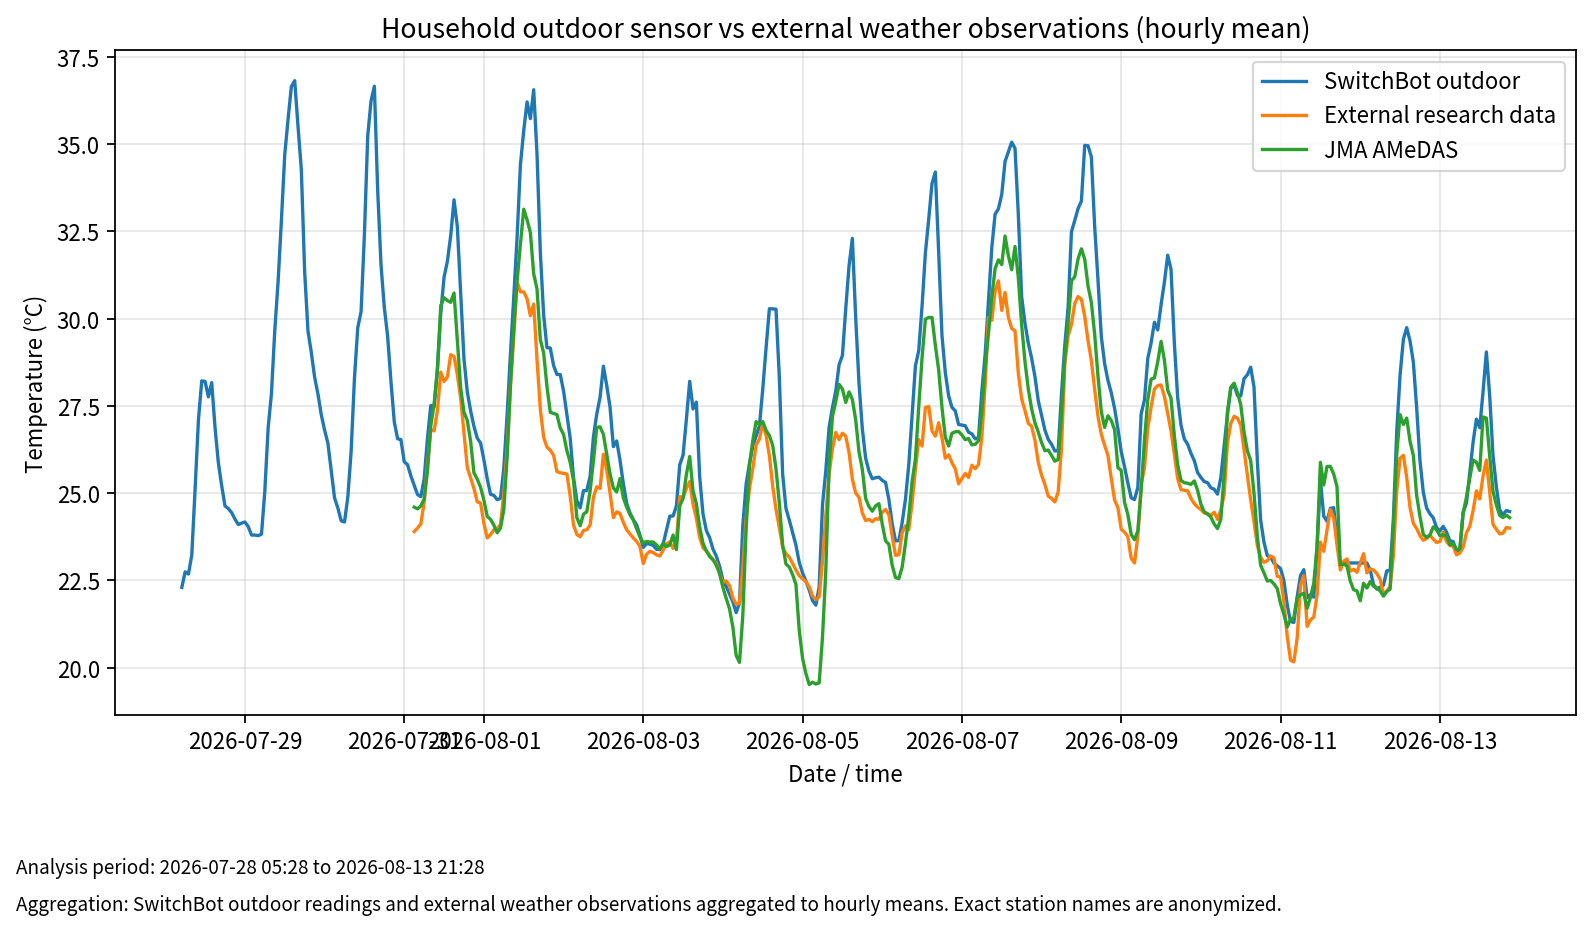
| Comparison | Temperature correlation | Mean difference from household outdoor sensor |
|---|---|---|
| Anonymized external observation A | about 0.924 | household sensor about +1.72 °C |
| Anonymized external observation B | about 0.944 | household sensor about +1.16 °C |
The strong correlations show that the household outdoor sensor followed regional temperature variation. The mean offsets can include installation, local microclimate, and sensor effects, so they are not assigned solely to calibration error.
5. SUCCESS does not guarantee a valid measurement
The original analysis found a physically implausible 0.0 °C value in a row whose API state was SUCCESS. Transport/API success and physical measurement validity must therefore be validated separately.
Raw values are retained for audit. Analysis datasets should add explicit quality states such as VALID, MISSING, OUTLIER, and INVALID rather than silently deleting the raw evidence.
6. Operational failure of an external weather API path
Open-Meteo was initially used as an external-weather source, but long-running unattended operation encountered access-limit-related missing data. Lowering request frequency did not provide the continuity required by this workflow, so it was removed as the primary source.
The resulting lesson is that an API being technically callable is different from it being operationally suitable at the required cadence and duration.
7. Limitations
- Sensors were not calibrated against traceable reference instruments.
- The original physical statistics cover only a short summer interval and do not represent annual behavior.
- Data now extend through 2026-09-06, but full-period physical statistics are not verified until observation-slot normalization is completed.
- Relative and absolute humidity alone cannot determine material moisture content, surface condensation, or mold risk.
- Causal attribution of CO2 peaks to occupancy, window opening, or ventilation is unresolved.
- Raw household telemetry remains private.
- Controlled ventilation interventions are handled as separate experiments rather than merged into this long-term observational record.
8. Next analyses
The extended dataset should first be normalized across target, acquisition, and storage timestamps. Expected nominal five-minute slots can then be classified for missing, duplicate, delayed, and valid observations. Only after that step should full-period temperature, RH, absolute-humidity, and CO2 statistics be recomputed.
Subsequent analyses can estimate seasonal behavior, outdoor-to-attic/crawl-space response timing, condensation-related metrics, and relationships with equipment operation and energy use. Missing values must remain distinguishable from measured zero and from estimated values; retained raw data should not be overwritten.
9. Reproducibility boundary
Technical reproduction requires owned environmental sensors, OpenAPI authentication, Apps Script or an equivalent scheduler, nominal five-minute acquisition, separated measurement/configuration/log stores, absolute-humidity calculation, per-device failure isolation, and an analysis stage that treats timestamp quality and physical outliers explicitly.
Credentials, device IDs, spreadsheet identifiers, household-specific labels, precise residence location, and raw household telemetry are not required for reproduction and are not published.
10. Revision history
- 2026-08-14 — ANALYSIS_ADDED: Published temperature, moisture, CO2, and external-weather analysis for the original 104,578-row subset.
- 2026-09-06 — DATA_ADDED / ANALYSIS_ADDED: Re-audited the private longitudinal store at 270,760 rows; observed 270,698 SUCCESS and 62 ERROR rows, approximately 99.977% row-level API-state success; explicitly separated raw row count from nominal five-minute slot completeness and scoped the original physical statistics to their verified analysis window.
Summary
The value of this experiment is not only the accumulated residential telemetry. Long-running operation showed that API transport success, physical measurement validity, and observation-slot completeness are separate quality dimensions.
Collection continued through the 2026-09-06 audit, but full-period physical statistics will not be promoted merely because more rows exist. They will be recomputed only after time alignment, missingness, and duplicate/delayed-record handling are formally defined, while the original observations, failures, and later quality findings remain preserved in the same evidence history.