Experiment record
USB power-induced temperature and humidity bias in SwitchBot Meter Pro (CO2 Monitor)
A USB → battery → USB rechallenge showed a repeatable roughly +0.57 °C positive temperature bias on a SwitchBot Meter Pro (CO2 Monitor) under USB power. The bias nearly disappeared on battery while the same 30-minute CO2 update setting was retained, then returned after USB reconnection.
Summary
A SwitchBot Meter Pro (CO2 Monitor), model W4900010, was compared with two other SwitchBot temperature/humidity meters mounted side-by-side on the same living-room wall.
The experiment deliberately changed the Meter Pro (CO2 Monitor) through the sequence USB power → AA battery power → USB power again, while the later phases kept the CO2 update interval at 30 minutes. The numerical source of record was the retained Google Sheets Measurements log; values previously read from photographs were not used for the final statistics.
Independent regeneration from the retained measurements reproduced the principal result:
| Condition | Stable window (JST) | N | Mean ΔT | Median | SD |
|---|---|---|---|---|---|
| USB power, CO2 30 min | Aug 22 21:43–23:58 | 28 | +0.57143 °C | +0.55 °C | 0.03951 °C |
| Battery, CO2 30 min | Aug 23 08:03–08:28 | 6 | +0.01667 °C | +0.025 °C | 0.04082 °C |
| USB rechallenge, CO2 30 min | Aug 23 09:13–10:38 | 18 | +0.57222 °C | +0.55 °C | 0.08613 °C |
The USB-to-battery change was -0.55476 °C and the battery-to-USB-rechallenge change was +0.55556 °C. The near-symmetric reversal is strong evidence that the approximately +0.55 to +0.60 °C bias was associated primarily with the USB-powered state and internal self-heating, rather than being only a fixed inter-device offset.
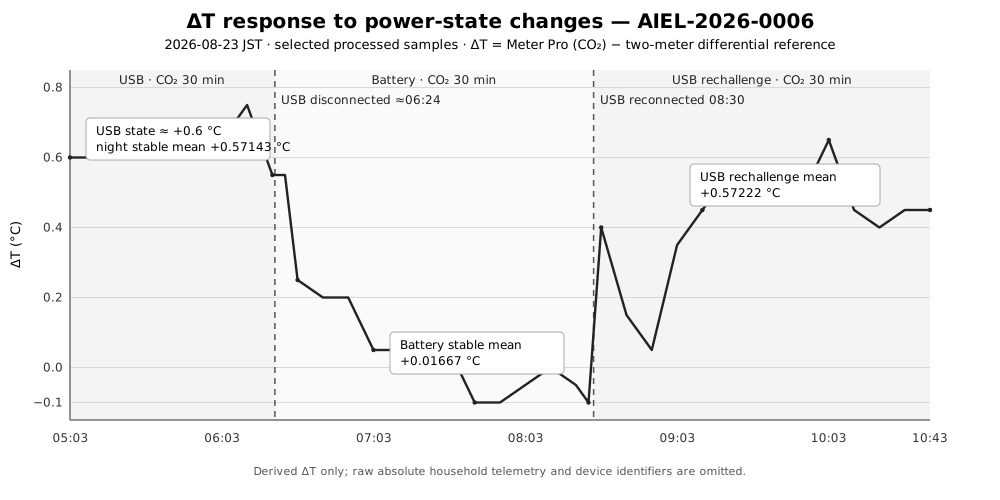
Selected processed ΔT samples show the cooling response after USB disconnection and the return of the positive bias after USB reconnection. The phase-summary statistics remain the numerical reference.
For normal continuous USB operation, the operator adopted a -0.6 °C field correction. Humidity correction was left at 0 %RH because the experiment did not provide a traceable humidity reference and could not cleanly separate device-specific RH offset from the USB/self-heating contribution.
Background
A third-party comparison supplied by the operator had reported that the Meter Pro (CO2 Monitor) could read roughly 0.5–0.8 °C warmer than other SwitchBot meters when USB-powered, and that the difference became smaller on battery. That report was treated as a Source claim, not Experiment Evidence.
SwitchBot’s own support documentation also provides relevant context. It states that battery operation updates CO2 every 30 minutes, while 5 V / 1 A Type-C power normally switches CO2 updating to one minute and allows the interval to be customized. SwitchBot warns that sufficiently frequent CO2 operation can warm the device and affect sensor accuracy. The manufacturer also recommends co-locating meters with spacing and stabilization time when comparing temperature/humidity readings.
The experiment therefore asked a narrower causal question: if the CO2 update interval is held at 30 minutes, does changing only the power state from USB to battery and back to USB produce a reversible temperature difference?
Methods
Devices and placement
Three SwitchBot meters were placed side-by-side at approximately the same height on one living-room wall, with about 5 cm between devices:
- DUT: SwitchBot Meter Pro (CO2 Monitor), model W4900010;
- comparison 1: SwitchBot Thermometer and Hygrometer Plus, model W2301500;
- comparison 2: SwitchBot MeterTH S1.
The room air conditioner was operating continuously, and the three devices were exposed to substantially the same local airflow. No calibration-certified reference thermometer or hygrometer was used, so this is a differential field comparison rather than absolute calibration.
Comparison 2 already had app-side corrections of +0.1 °C and -2 %RH. The analysis reversed those corrections to reconstruct the pre-correction-equivalent values:
T_comparison2_uncorrected = T_comparison2_displayed - 0.1 °C
RH_comparison2_uncorrected = RH_comparison2_displayed + 2 %RH
The two-device differential reference was then:
T_ref = (T_comparison1 + T_comparison2_uncorrected) / 2
RH_ref = (RH_comparison1 + RH_comparison2_uncorrected) / 2
with:
ΔT = T_CO2 - T_ref
ΔRH = RH_CO2 - RH_ref
Data source and duplicate handling
The numerical source of record is a private Google Sheets Measurements log.
The human reported the experiment as beginning at approximately 2026-08-22 18:35 JST and ending at 2026-08-23 12:43 JST. The first retained actual-acquisition block after the approximate start is about 18:38:17, and the last retained block in the reported end minute is about 12:43:18.
The sheet contains duplicate record pairs around acquisition cycles. The regenerated analysis retained only rows where the acquisition-target time equalled the record time, then kept the three co-located meters and calculated ΔT and ΔRH.
The physical sensor sampling interval, SwitchBot cloud update behavior, app display interval, and the approximately five-minute Google Sheets API collection cadence are treated as separate concepts.
Experimental phases
- Phase A — USB / CO2 1 min: approximately Aug 22 18:35–21:13.
- Phase B — USB / CO2 30 min: Aug 22 21:13 to approximately Aug 23 06:24.
- Phase C — battery / CO2 30 min: approximately Aug 23 06:24–08:30.
- Phase D — USB rechallenge / CO2 30 min: Aug 23 08:30–12:43.
Immediately after battery insertion or USB connect/disconnect, the device was physically handled and its temperature was in transition. Those intervention-adjacent values were retained in the processed time series but excluded from the steady-state statistics.
Experiment Log
Aug 22 — initial USB comparison
The experiment began with the Meter Pro (CO2 Monitor) on USB Type-C power and the CO2 update interval at one minute. The CO2 meter generally read about +0.5 to +0.7 °C warmer than the two-device differential reference.
At 21:13 JST, the CO2 update interval was changed from one minute to 30 minutes while USB power was maintained.
Overnight — USB remained warm at 30-minute CO2 updating
Reducing the CO2 update frequency did not remove the temperature difference. In the stable Aug 22 21:43–23:58 window, independent regeneration gave mean ΔT +0.57143 °C.
This observation weakened the hypothesis that one-minute CO2 updating itself was the principal cause of the roughly +0.6 °C bias.
Aug 23 morning — switch to batteries
At approximately 06:24 JST, two AA batteries were installed and USB was disconnected while the CO2 update interval remained at 30 minutes.
The positive temperature difference then decayed over tens of minutes. The practical response was approximately:
- initially about +0.6 °C;
- about +0.3 °C after roughly 10 minutes;
- about +0.2 to +0.3 °C after roughly 20–30 minutes;
- approximately 0 to +0.1 °C after roughly 40–60 minutes.
In the stable 08:03–08:28 window, mean ΔT was only +0.01667 °C.
08:30 — USB rechallenge
At 08:30 JST, USB Type-C power was reconnected while the batteries remained installed, and the 30-minute CO2 update setting was retained.
The positive difference returned over the following tens of minutes. In the stable 09:13–10:38 window, mean ΔT was +0.57222 °C — effectively the same as the earlier USB/30-minute condition at the measurement resolution of the setup.
The independently regenerated phase changes were:
- USB → battery: -0.55476 °C;
- battery → USB rechallenge: +0.55556 °C.
Relative humidity
The same differential analysis gave steady-state mean ΔRH values of approximately:
- USB / 30 min: -4.32 %RH;
- battery / 30 min: -2.50 %RH;
- USB rechallenge / 30 min: -3.86 %RH.
This pattern is consistent with a device-specific RH difference plus an additional USB/self-heating contribution, but those components cannot be converted into a traceable absolute humidity correction from this experiment alone.
Post-experiment field correction
For normal USB-powered use, the operator set the Meter Pro (CO2 Monitor) temperature correction to -0.6 °C. A retained SwitchBot calibration-screen screenshot confirms the setting.
The humidity correction was left at 0 %RH.
Conclusion
In this installation, the SwitchBot Meter Pro (CO2 Monitor) W4900010 showed a reproducible approximately +0.55 to +0.60 °C positive temperature bias relative to two co-located SwitchBot meters when USB Type-C powered.
The bias remained after the CO2 update interval was reduced from one minute to 30 minutes. With the 30-minute setting unchanged, the bias nearly disappeared after switching to battery power and returned to approximately +0.57 °C after USB was reconnected. Independent regeneration from the retained Google Sheets measurements reproduced the principal phase statistics and the near-symmetric USB → battery → USB response.
The evidence therefore supports, with high confidence, the inference that the principal cause of the observed temperature difference was the USB-powered state and associated internal self-heating. The experiment does not rule out a smaller contribution from CO2 measurement activity.
A -0.6 °C field correction is reasonable for the tested continuous-USB operating mode. It is not a traceable absolute calibration value and should be removed or reassessed if the device is later used primarily on battery.
Humidity showed a repeatable relative difference, but no absolute RH correction was established; the operator retained 0 %RH correction.
Evidence summary
The Evidence States for the information obtained in this Experiment are as follows.
| Recorded content | Evidence State | Basis in this experiment |
|---|---|---|
| USB/30-minute operation produced mean ΔT +0.57143 °C, battery operation +0.01667 °C, and USB rechallenge +0.57222 °C | OBSERVED | Independently regenerated from retained Google Sheets rows using the documented duplicate-removal and reference-reconstruction rules |
| The principal cause of the roughly +0.55 to +0.60 °C bias was the USB-powered state and associated internal self-heating | INFERRED | Bias persisted at 30-minute CO2 updating, nearly disappeared on battery, and returned on USB rechallenge under the same update setting |
| -0.6 °C is a reasonable field correction for the tested continuous-USB operating mode | INFERRED | Both stable USB conditions were about +0.57 °C relative to the differential reference; the actual setting was confirmed by screenshot |
| This experiment does not establish an absolute humidity correction | INFERRED | ΔRH changed with power state, but no traceable reference was used and device-specific versus thermal contributions were not separable |
See Evidence State for the shared definitions.
Operational implications
For this device and installation, changing the CO2 update interval alone is not an adequate substitute for accounting for USB-related temperature bias. A correction selected for continuous USB use should not automatically remain in place if the device is later changed to battery operation.
The observed thermal response also means that comparisons made immediately after connecting or disconnecting USB can be misleading. In this experiment, roughly 40–60 minutes was a practical stabilization period after a power-state change.
The temperature correction changes the displayed/recorded temperature offset; it does not remove the device’s internal heat source. Derived quantities that depend on the reported temperature should therefore be interpreted with the correction mechanism and power state in mind.
Experiment data
The original Google Sheets measurements and the private analysis workbook are retained for reanalysis but are not published because they contain installation-specific identifiers and unnecessary absolute household telemetry.
A publication-safe aggregate containing only the three stable analysis windows and derived differential statistics is available as CSV:
AIEL-2026-0006 phase-summary.csv
Photographs and screenshots are supporting Evidence for device identity, placement, settings, and physical interventions; they are not the numerical source of record for the statistics above.
Sources
Manufacturer documentation was used as contextual Source material, separate from Experiment Evidence:
- SwitchBot — Update Frequency of CO2 Readings on SwitchBot Meter Pro (CO2 Monitor)
- SwitchBot — What to Do If the Temperature and Humidity Reading Is Different on My Meter Pro and CO2 Monitor?
- SwitchBot — Meter Data Update Frequency
The operator also supplied a third-party SwitchBot meter comparison video (@gadget-homes, video ID 6FFztWCIVw0) that reported a similar USB-powered temperature difference. That report motivated the comparison but was not used to calculate or establish the Experiment result.
Machine-readable experiment record
A machine-readable canonical record of this Experiment is published as JSON.
AIEL-2026-0006 experiment.json
Related experiments
The underlying private SwitchBot/Google Apps Script household collection path is documented in Long-term household environment collection, external weather integration, and analysis with SwitchBot and Google Apps Script.
A separate experiment used the same Meter Pro (CO2 Monitor) measurement path for SwitchBot CO2 alerts to a family LINE group with Google Apps Script.